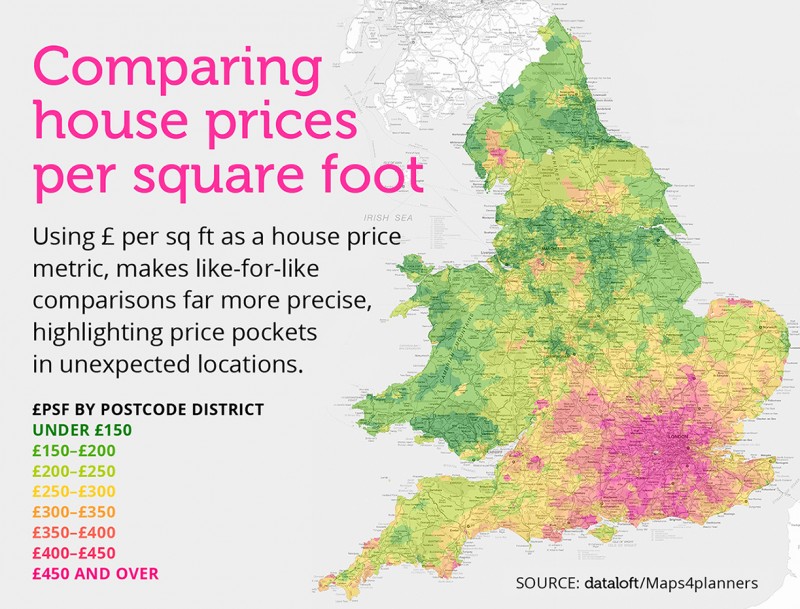
The map shows an average price per square foot for almost 2,300 postcode districts in England and Wales, based on an analysis of 470,000 sales recorded so far in 2017. While there is a clear pattern of high value weighted towards the South East, the price per square foot associated with the wider South East is replicated in pockets across the UK. In fact, every region has at least one pocket of yellow and there are clusters around York and Harrogate, the Peak District and Cheshire. It is no surprise to see an enormous pink area covering London, indicating high values per sq ft, but high values are not confined to the South East and it is interesting that there are hotspots in the Lake District, North Norfolk, the north and south Cornish coast and Bristol. But if affordability is the driver, it is clear that the North East, North West and Wales continue to be the UK’s most accessible housing markets. It is interesting to speculate on what High Speed Rail link (HS2) could do to this map when it reduces journey times to London, and also on the emerging trend for young professionals, priced out of London markets, to buy homes elsewhere and to rent in London.
What's happening with your property value in the current market?


 Client Login